No data available. Please add comparisons to see them here.
TL;DR
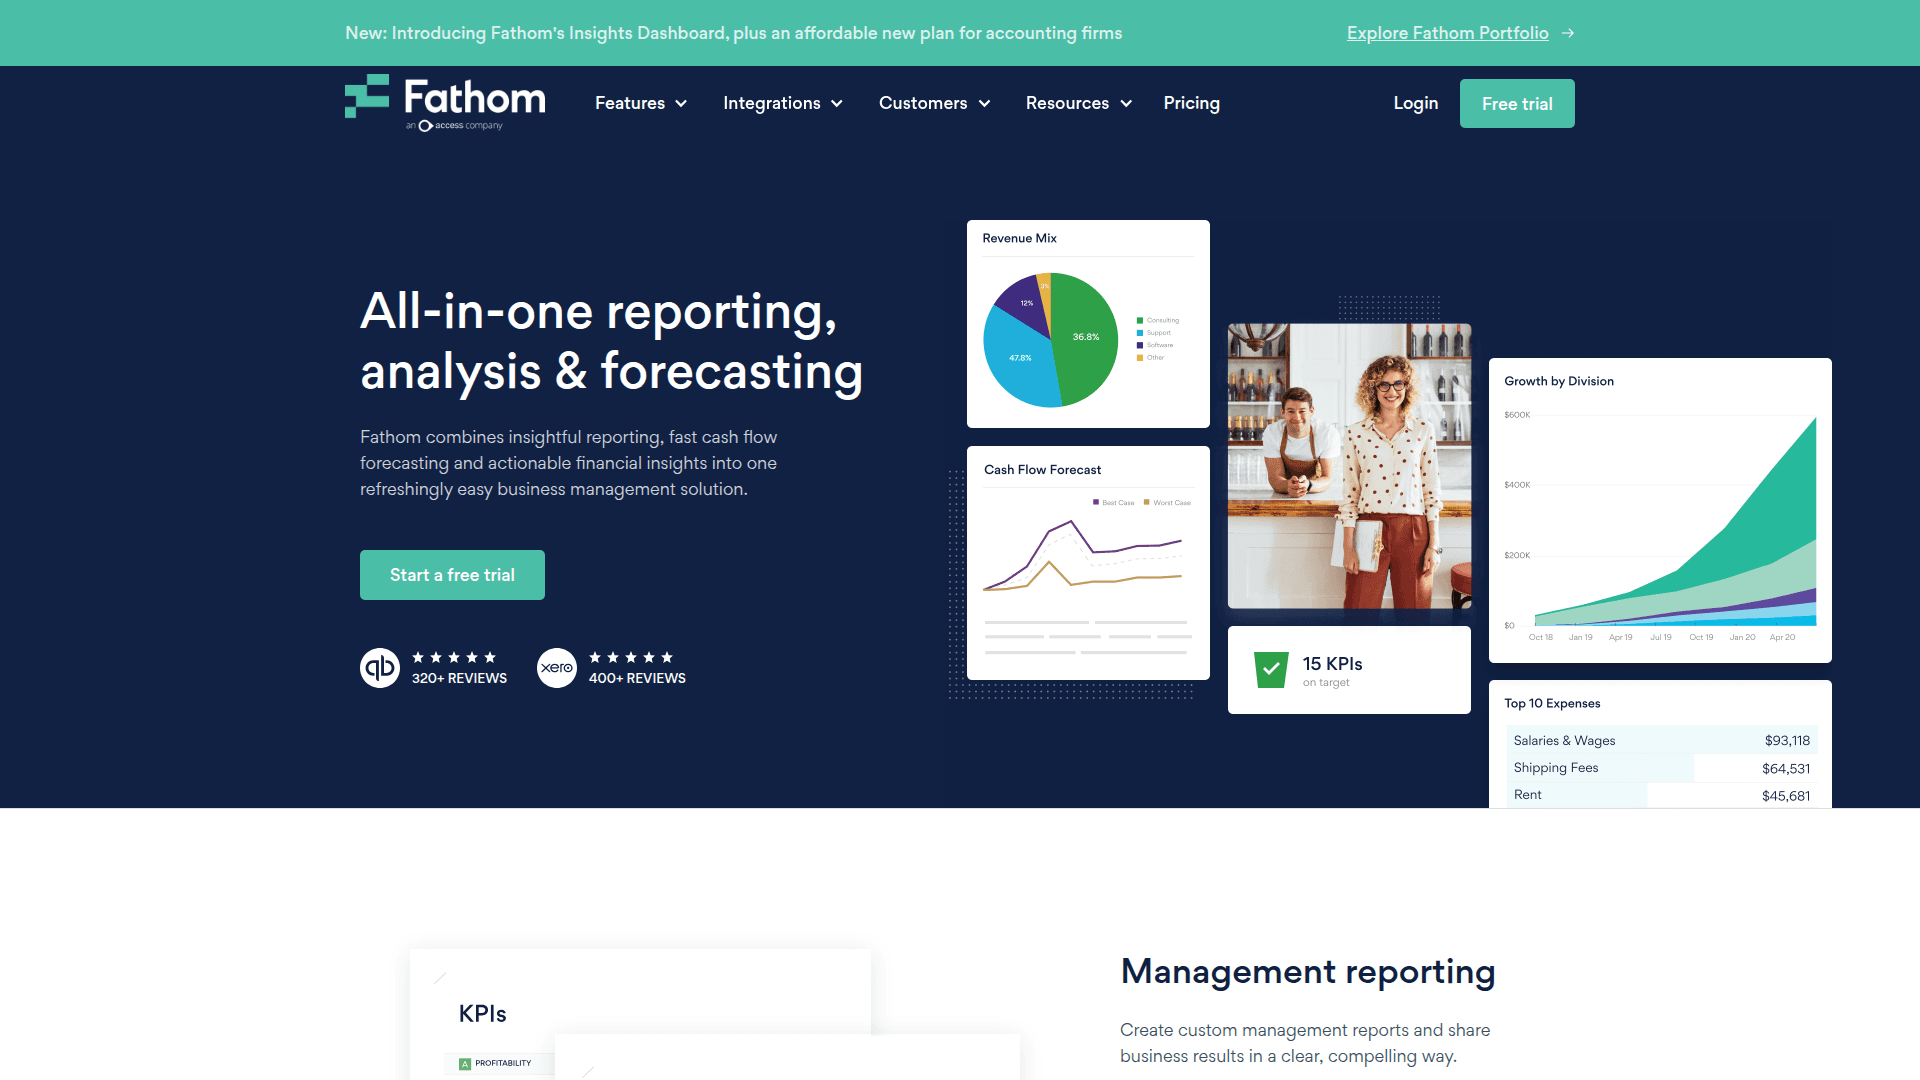
Financial reporting, KPI analysis, and three-way cash flow forecasting in one platform.
Built for SMBs, accounting firms, franchises, and multi-entity groups.
Seamless integrations with QuickBooks, Xero, MYOB, Sage, Excel, and Google Sheets.
New Insights Dashboard and Portfolio for firm-wide client oversight and engagement.
What is Fathom
Fathom is a financial reporting, analysis, and forecasting platform that consolidates management reporting, KPI dashboards, group benchmarking, and three-way cash flow forecasting into a single system. It solves the common pain points of fragmented spreadsheets, manual consolidations, and slow, error-prone reporting by integrating directly with accounting systems like QuickBooks, Xero, MYOB, and Sage, and by supporting imports from Excel and Google Sheets. As an FP&A and management reporting solution, Fathom helps businesses, accounting firms, and multi-entity groups turn accounting data into clear insights, automated reports, and forward-looking financial plans.
0.0
(0)
Updated: October 13, 2025
Loading...
Loading...
Loading...
Loading...
Loading...
Loading...
FAQs
Still have questions? We're here to help!
User Reviews
0.00 verified reviews
No reviews yet.
Submit Your Review
Tool Information
Website
Tool PlanTrial
Verified Review Process
All reviews are from verified users. Our editorial team tests each tool thoroughly before publishing reviews. We maintain editorial independence from tool providers.
Intuitive report builder and visual dashboards make insights accessible to non-finance users.
Three-way cash flow forecasting streamlines forward planning and scenario analysis.
Who is Fathom for?
Accounting firms and bookkeeping practices delivering advisory and management reporting.
SMB finance teams and business managers needing clear reports and cash flow visibility.
Fractional CFOs, FP&A analysts, and controllers standardizing KPI tracking and board packs.
Franchises and multi-entity groups requiring consolidated reporting and benchmarking.
Advisory-led firms seeking a scalable portfolio view to monitor and engage all clients.
Cons
Entity mapping for consolidations can be time-consuming if charts of accounts differ significantly.
Non-financial/operational data analysis depends on manual imports via Sheets/Excel for many scenarios.
Real-time granularity is constrained by the sync cadence and structure of connected accounting systems.
Some plans list company limits; scaling across many entities may require higher tiers or new plans.
Pricing Info
Starter plan includes 1 company — $53/month (monthly). Features: Unlimited brandable reports, in-depth analysis tools, group benchmarking, multi-currency consolidations, cash flow forecasting, unlimited users, multi-channel support, certifications and training.
Silver plan includes 10 companies — $280/month (monthly). Features: Unlimited brandable reports, in-depth analysis tools, group benchmarking, multi-currency consolidations, cash flow forecasting, unlimited users, multi-channel support, certifications and training.
Gold plan includes 25 companies — $400/month (monthly). Features: Unlimited brandable reports, in-depth analysis tools, group benchmarking, multi-currency consolidations, cash flow forecasting, unlimited users, multi-channel support, certifications and training.
Platinum plan includes 50 companies — $720/month (monthly). Features: Unlimited brandable reports, in-depth analysis tools, group benchmarking, multi-currency consolidations, cash flow forecasting, unlimited users, multi-channel support, certifications and training.
Management Reporting: Create custom, brandable management reports with text, charts, tables, and financial statements, and schedule automated delivery to stakeholders.
Three-Way Cash Flow Forecasting: Build integrated P&L, Balance Sheet, and Cash Flow forecasts to understand liquidity, evaluate plans, and assess different scenarios with confidence.
Financial Analysis & KPIs: Track the metrics that matter using visual dashboards and KPI monitoring to quickly identify trends, performance gaps, and improvement opportunities.
Consolidated Reporting: Produce fast, accurate multi-entity consolidations with support for multi-currency, enabling groups and franchises to report at entity and group levels.
Group Benchmarking: Compare and rank companies, clients, or franchisees to highlight top performers and outliers across consistent KPI frameworks.
Insights Dashboard (Portfolio): Monitor your entire client base with configurable metrics and simple summary views—designed for accounting firms to boost proactive engagement.
Integrations: Connect to QuickBooks (Online/Desktop), Xero, MYOB, Sage, Access Financials UK, import via Excel, and sync operational data from Google Sheets for a fuller business view.
Unlimited Users: Invite unlimited users to collaborate across analysis, reporting, and forecasting without per-seat constraints.
Brandable, Shareable Reports: White-label reports and export for print or web to communicate results clearly to investors, lenders, and internal stakeholders.
Automation & Scheduling: Put reporting on autopilot with scheduled report delivery and streamlined refreshes from connected ledgers.
Robust consolidations with multi-currency support suit groups and franchises.
Tight integrations with major accounting platforms plus Excel and Google Sheets imports.
Unlimited users enable broad collaboration without per-seat cost friction.
Portfolio Insights Dashboard gives firms an at-a-glance view across their client base.
Highly brandable, presentation-ready reports suitable for investors and lenders.
Certification and training resources support onboarding and best-practice adoption.